The Invisible Force: A Visual History of Blood Pressure
From a clergyman's horse experiment in 1733 to the digital cuff on your wrist: how humanity learned to measure the pressure of life itself.
Right now, without thinking about it, your heart is contracting 60 to 100 times per minute. Each contraction sends a wave of pressure rippling through 60,000 miles of blood vessels. That pressure keeps you alive.
We check it in a few seconds at a pharmacy kiosk. We track it on smartwatches. But for most of human history, blood pressure was completely invisible, an internal force that no one knew how to see, let alone measure.
This is the story of how we finally did.
What Is Blood Pressure, Exactly?
When your heart beats, it squeezes blood into your arteries. That blood pushes against the artery walls, and that push is blood pressure.
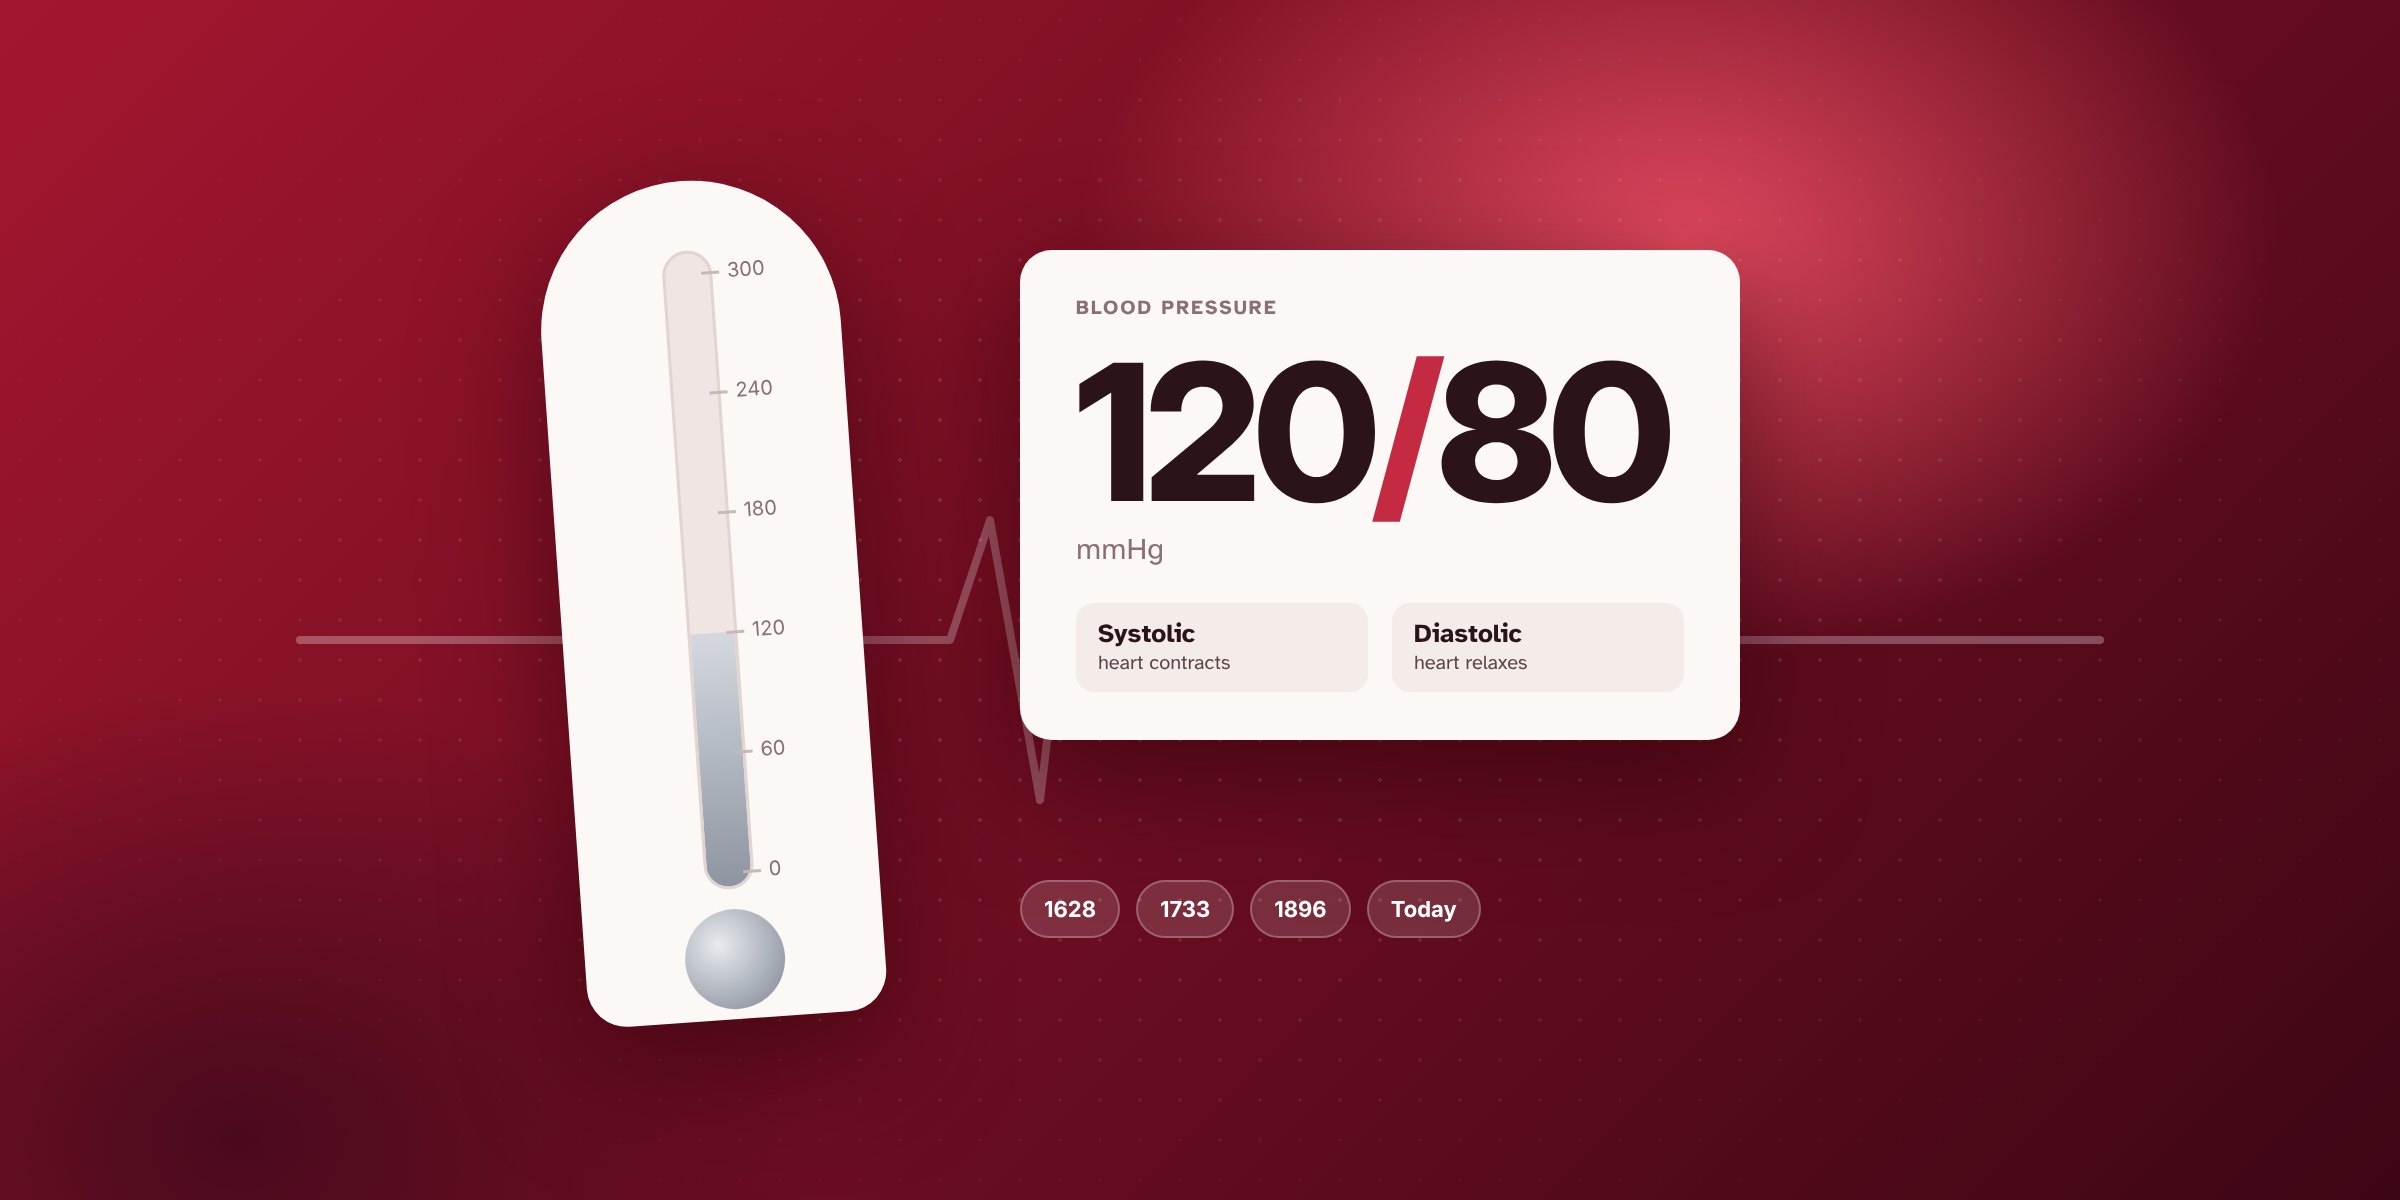
Blood pressure is measured as two numbers: 120/80 mmHg is considered normal.
The top number, systolic, is the pressure when your heart contracts and forces blood outward. It’s the maximum pressure your arteries experience.
The bottom number, diastolic, is the pressure when your heart relaxes between beats. Even at rest, your arteries maintain baseline pressure to keep blood flowing to your organs.
The unit “mmHg” (millimeters of mercury) dates back to early experiments where scientists literally watched blood push a column of mercury up a glass tube. We still use the same unit today.
Each heartbeat sends a wave of pressure through your arteries. The vessel walls flex outward (systolic) then spring back (diastolic).
Your arteries are not rigid pipes. They’re elastic: they expand slightly during systole and spring back during diastole. This elasticity is why a single heartbeat doesn’t cause a jarring pressure shock each time. Older, stiffer arteries lose this elasticity, which is why systolic pressure tends to rise with age.
The Ancient World: Pulse Without Pressure
The ancient world was fascinated by the pulse long before anyone connected it to pressure.
Egyptian papyri dating to around 1550 BCE describe the heart as a kind of central distributor. “The heart speaks from every limb,” one papyrus reads. Physicians were trained to feel the pulse at the wrist, temples, and feet, the same spots we check today.
The Greeks went further. Around 450 BCE, Praxagoras of Cos distinguished between arteries and veins. He made one spectacular error, though: he believed arteries were filled with air (pneuma), not blood. This is why the word “artery” comes from the Greek arteria, meaning “air container.” The mistake persisted for nearly eight centuries.
By the time of Galen (129–216 CE), physicians understood that arteries carried blood. Galen could describe the pulse in extraordinary detail (fast, slow, strong, weak, irregular) and used it for diagnosis. But pulse quality and blood pressure are different things. Galen had no concept of pressure as a force that could be quantified.
For over a thousand years, the pulse remained qualitative: a language the physician could read, but not a number anyone could write down.
1628: Harvey Changes Everything
Understanding blood pressure required something more fundamental first: understanding that blood circulates at all.
Before William Harvey, the dominant theory (Galenic medicine) held that blood was continuously produced in the liver, consumed by the body, and never returned. The heart was more of a furnace than a pump.
In 1628, Harvey published De Motu Cordis (“On the Motion of the Heart”). Through dissection and direct observation (in frogs, snakes, fish, and human cadavers) he demonstrated that blood circulates in a closed loop, driven by the heart as a pump.
The math alone was decisive. Harvey calculated that the heart ejects about two ounces of blood per beat. At 72 beats per minute, that’s over 10 pounds of blood per minute, far more than the liver could possibly produce. The blood had to be the same blood, circulating.
Harvey didn’t measure blood pressure. But by establishing the heart as a pump driving blood through a closed circuit, he created the conceptual scaffold on which pressure measurement would later be built.
1733: A Clergyman, a Horse, and a Glass Tube
The first person to actually measure blood pressure was not a physician. He was an English clergyman named Stephen Hales.
Hales was a polymath who also invented forced-air ventilation systems for ships and granaries, but his most dramatic experiment took place in 1733, in his garden in Middlesex.
He restrained a live horse on its back. He isolated the left femoral artery and tied it off. Then he inserted a brass pipe, connected to a nine-foot glass tube, directly into the artery.
When he released the artery, blood shot up the tube and stabilized at 8 feet 3 inches above the horse’s left ventricle.
He had just measured blood pressure.
The column of blood would rise and fall slightly with each heartbeat, the first recorded visualization of systolic and diastolic variation. Hales also noted that the blood pulsed faster “after the horse had struggled,” an early observation of how exertion affects pressure.
The experiment was invasive, uncomfortable for the horse, and obviously impractical for human patients. But it established a proof of concept: blood pressure was a real physical quantity that could be measured.
A Century of Refinement
After Hales, progress came slowly. The challenge was the same one medicine always faces with invasive tests: you can’t routinely cut open arteries to check a routine vital sign.
Several key milestones bridged Hales’s experiment to the modern cuff:
The Pulse as Oracle
Ancient Egyptian physicians recorded that the heart "speaks" from every vessel in the body. They associated the pulse with life force — but had no concept of pressure.
Arteries vs. Veins
Greek physician Praxagoras distinguished arteries from veins, believing arteries carried pneuma (air) rather than blood. The word "artery" derives from the Greek for air-carrier.
Harvey Maps the Circulation
William Harvey published De Motu Cordis, proving blood circulates in a closed loop driven by the heart. This was the foundational insight that made blood pressure measurable in principle.
The First Measurement
Stephen Hales inserted a brass pipe into a horse's left femoral artery, connected to a glass tube. Blood rose to 8 feet 3 inches — the first direct measurement of blood pressure in history.
The Kymograph
Carl Ludwig invented the kymograph, a rotating drum that recorded blood pressure as a continuous wave. For the first time, the heartbeat could be read like a graph.
First Non-Invasive Device
Samuel von Basch invented the first sphygmomanometer — a water-filled device pressed against the radial artery. It was clunky, but it didn't require cutting anyone open.
Riva-Rocci's Cuff
Scipione Riva-Rocci designed the inflatable arm cuff and mercury column that we still recognize today. Harvey Cushing brought it to the USA in 1901 and it spread across hospitals worldwide.
Korotkoff Sounds
Russian physician Nikolai Korotkoff described the tapping sounds heard through a stethoscope as cuff pressure releases. These sounds define the systolic and diastolic numbers we report today.
The First Drugs
Reserpine and hydralazine became the first antihypertensive medications. For the first time, high blood pressure was treatable — not just observable.
Wrist & Wearable Monitoring
Consumer wearables began estimating blood pressure using photoplethysmography (PPG). While not as accurate as cuff devices, they democratized awareness of cardiovascular health.
The crucial insight came from a Russian physician named Nikolai Korotkoff in 1905.
Korotkoff noticed that when an inflated cuff around the arm was slowly deflated, a stethoscope placed over the artery below the cuff picked up distinct tapping sounds. These sounds, now called Korotkoff sounds, appear when the cuff pressure drops below systolic pressure, letting blood spurt through, and disappear when the cuff pressure drops below diastolic pressure, letting blood flow freely and silently.
The first tap: systolic pressure. The last tap: diastolic pressure.
This is still exactly how a manual blood pressure reading works today.
What the Numbers Actually Mean
Once Riva-Rocci’s cuff and Korotkoff’s sounds were combined, doctors had a practical tool. But what do the numbers mean? Try it yourself:
Blood Pressure Explorer
Drag the sliders to see how readings are categorized
The current classification system (from the American Heart Association, updated 2017):
- Normal: below 120/80 mmHg
- Elevated: 120–129 systolic, less than 80 diastolic
- Stage 1 Hypertension: 130–139 / 80–89 mmHg
- Stage 2 Hypertension: 140+ / 90+ mmHg
- Hypertensive Crisis: above 180/120 mmHg, requires emergency care
What makes hypertension insidious is that it usually has no symptoms. You can have dangerously high blood pressure for years without knowing. It silently damages arteries, strains the heart, and increases the risk of heart attack, stroke, and kidney disease.
According to the World Health Organization, 1.28 billion adults worldwide have hypertension, and nearly half of them don’t know it.
The Animal Comparison
To understand what “normal” means for humans, it helps to see how varied pressure is across species:
Giraffes have the highest blood pressure of any mammal, around 280/180 mmHg. Their hearts need to pump blood nearly 10 feet upward to reach their brains. They’ve evolved extraordinarily thick-walled hearts and complex vascular mechanics in their necks to prevent them from fainting when they lower their heads to drink.
Whales, despite their enormous size, have relatively low blood pressure (~75/45 mmHg). Their cardiovascular system is built for a very different challenge: pumping blood through a vast body at relatively low pressure, efficiently.
Mice have blood pressure similar to humans (around 120/80 mmHg), which is one reason they’re used in cardiovascular research.
From Mercury Columns to Your Wrist
The sphygmomanometer spent most of the 20th century as a device only doctors owned. Measurement required a trained ear, a stethoscope, and a willing patient sitting still.
The 1970s brought the first oscillometric electronic monitors that detect the tiny oscillations in artery walls caused by blood flow, without a stethoscope. The technology made home monitoring possible for the first time.
By the 2000s, a validated home blood pressure monitor cost less than $30. The American Heart Association now recommends home monitoring because “white coat hypertension” (elevated readings caused by the anxiety of a doctor’s visit) can mislead clinical readings by 10–20 mmHg.
The latest generation of wearables attempts to measure blood pressure without a cuff at all, using photoplethysmography (PPG): shining a light through the skin and measuring how blood volume changes with each heartbeat. These devices aren’t yet as accurate as cuff-based measurement, but the gap is closing.
The trajectory is clear: a measurement that once required restraining a horse is now being taken 24 hours a day on your wrist.
Why Any of This Matters
When Stephen Hales stood in his garden in 1733 and watched blood rise nine feet up a glass tube, he wasn’t thinking about public health policy. He was curious. He wanted to know what was there.
That curiosity turned out to matter enormously. High blood pressure is the leading modifiable risk factor for cardiovascular disease, the world’s leading cause of death. Understanding it, measuring it, and treating it has likely saved tens of millions of lives.
The path from that horse’s artery to the digital monitor on your wrist took nearly 300 years. It required a clergyman with a glass tube, a Florentine inventor with an inflatable cuff, a Russian military surgeon with a stethoscope, and generations of engineers and physicians who kept refining the tools.
All of them were trying to make the invisible visible.
The numbers they bequeathed us (two small integers separated by a slash) carry the weight of that entire history.
The 2017 ACC/AHA blood pressure classifications are used in the interactive above. Classifications vary by organization; consult your physician for personalized guidance.